Groups collect a set of data rows, based on a common value, into a column called a group column. This allows you to identify rows with common factors. You can perform summary calculations on grouped data, such as counting all the rows in each group, or adding up the values for a data field in each group. You can also make charts to visualize the data in each group, and compare groups to each other.
Grouping data in an ExpressView
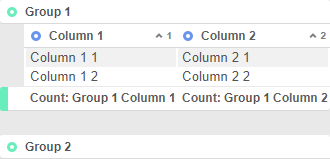
Making a Group
To turn a data column into a group column use  radial>up. Doing
this will organize the other columns into groups. Each row in the data column is
a unique group of the rows in the other columns. The group column has a new
color to distinguish it from the data rows. Remember to turn on Live
Data to see your actual data and verify that this is the desired
grouping.
radial>up. Doing
this will organize the other columns into groups. Each row in the data column is
a unique group of the rows in the other columns. The group column has a new
color to distinguish it from the data rows. Remember to turn on Live
Data to see your actual data and verify that this is the desired
grouping.
To ungroup a column, use
radial>left. This turns the group column back into a data
column.
Groups can be created inside other groups. These are called nested groups. To make a nested group, add another group to an ExpressView which already has one. Additional levels of nesting can be made as needed.
Changing group level
If you have two or more levels of grouping, you may decide that they are nested improperly. For example, if you had Products grouped by Orders, then you add another grouping on Employees, you may end up with Products grouped by Employees grouped by Orders.
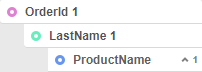
One possible data grouping
However, it makes more sense to have Orders grouped by Employees instead,
since Employees have multiple Orders, but Orders does not have multiple
Employees. To move the Employees group up one level, use radial>up on the
group column.
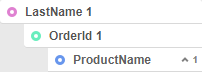
Changing the data grouping
Summarizing Group Data
Each group has a footer that contains summary calculations, or aggregates, for each column. There is also a report footer, which contains summaries for the entire ExpressView. You can choose one of several calculations for each column.
To change the calculation for a column, click a footer and select one of the following options:
Sum
Totals the data values in the group. Only available for numeric fields.
Min
Shows the smallest data value, or first value alphabetically, or earliest date in the group.
Max
Shows the largest data value, or last value alphabetically, or latest date in the group.
Count
Counts the number of values in the group.
Distinct Count
Counts the number of distinct values in the group.
Avg
Takes the average, or arithmetic mean, of the values in the group. Only available for numeric fields.
None
Show no summary calculation.
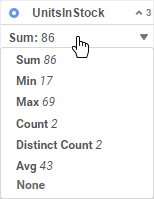
Choosing an aggregate
Hiding data rows
If you only want to see the summary calculations, you can hide the data rows, for each group, or for the entire ExpressView. This does not remove the data or alter the summaries; it only hides the rows from view.
Click the header for each group to toggle whether its rows are shown or hidden.
To hide or show all the rows in the ExpressView:
Click the Group Expand/Collapse Options  icon.
icon.
Click  Hide
All Group Content to hide all the rows, or
Hide
All Group Content to hide all the rows, or  Show All Group
Content to show all the rows.
Show All Group
Content to show all the rows.
If you have nested groups, this hides all but the top level groups.
To remove all data rows from the report and only show summary data, deselect Include Detail Rows. This may improve the performance for reports that do not depend on the detail values.